
Creating an ELK stack for visualizing KernelCI data!
Introduction
This post is intended to support documenting the KCING project, which stands for KernelCI New Generation. Note that the “New Generation” refers to the frontend part of KernelCI.
Linux Kernel developers know KernelCI because it is a good tool that helps exposing bugs by building images against a vast range of architectures and configurations, booting and testing some builds. All of this generates build/boot/test logs and this data is useful when a module maintainer/developer needs to fix a bug exposed by KernelCI. There are two means of getting this data to end users: by email and by a frontend user interface. Emails are fairly easy to customize because they are text templates, easy to change according to someone’s needs. The frontend, though, is a bit trickier to customize due to its entangled tech with lots of Python, Javascript, HTML, and CSS.
With this issue in mind, we, at Linaro, started a research project with the goal to find a better, uncomplicated way to visualize KernelCI data without having to go through all web development complexity.
NOTE: I assume the reader already knows a bit more of embedded systems CI, including KernelCI and LAVA. If not, feel free to contact me with any questions.
Understanding KernelCI data model
Here is a brief schematics of KernelCI’s workflow, involving builders and labs. Build jobs are distributed among builder instances that are told the git tree, branch, etc and all the necessary information to get a Kernel image compiled. KernelCI then decides which images should be booted and tested across available labs.
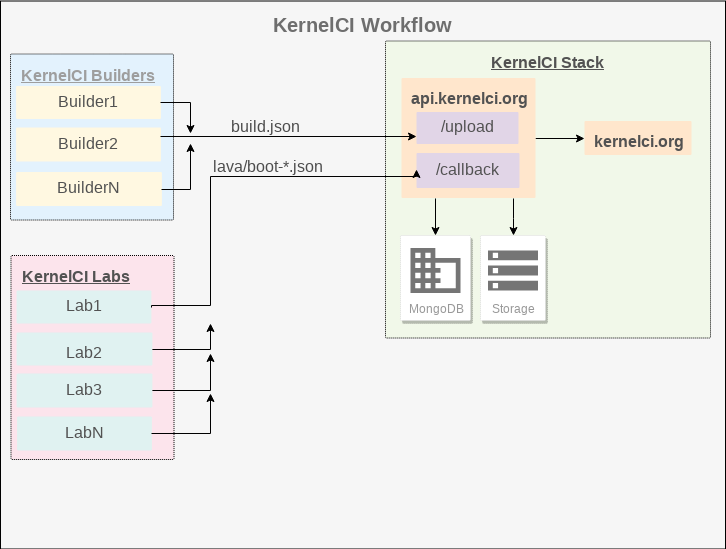
Although KernelCI uses MongoDB to keep its data, most of the action happens when builders and labs finish their jobs and send JSON files back to KernelCI. We understand that there are 3 main important types of files being consumed by KernelCI: build.json, boot.json and lava.json.
build.jsoncontains all metadata about a single build including the git tree, branch, which configuration was used (.config), which architecture that was built for, among other important information such as build result (pass or fail). Here is a sample of a build.json file.boot.jsoncontains important metadata about one kernel image as inbuild.jsonwith the addition of boot information such as load addresses, lab and board name, boot log and boot result (pass or fail). Here is a sample of a boot.json file.lava.jsonis a super set ofboot.jsongenerated by labs that run LAVA (although we’ve seen some lava.json files generated by a non-LAVA lab). This third type also contains information regarding tests that were run. Here is a sample of a lava.json file.
We took some time to understand these files. We needed to figure out a way to associate build with lava/boot in order to make aggregations and other types of queries. The most common data present in all 3 types of files are tree, branch, git-describe, config, and architecture.
Finding an off-the-shelf solution
Once we got the gist of the data structure that we needed to work on, next step was to find a suitable open source tool that could easily be set up as well as not too complicated to customize new frontends. We came down to two possible solutions: grafana and the ELK stack. Grafana is a great tool for monitoring and analyzing pre-defined sets of data, but it is mostly static. The ELK stack does a similar job as grafana, and on the plus side it offers interactive dashboards. We decided to go with that one.
ELK stands for ElasticSearch, Logstash and Kibana. The first one is a NoSQL database and string indexer, built on top of Apache Lucene which makes it great at indexing json objects and retrieving it real fast. The second works as log aggregator, combining a powerful scripting language to tweak data towards one’s goal. Finally, the third one is a grafana alternative, that reads data from ElasticSearch and allows technical and non-technical users to build meaningful dashboards.
Tooling defined, a strategy to retrieve data from KernelCI was needed. Without getting in to much detail on how that is done (still working on that), here is an abstract diagram based on the diagram a few paragraphs above.
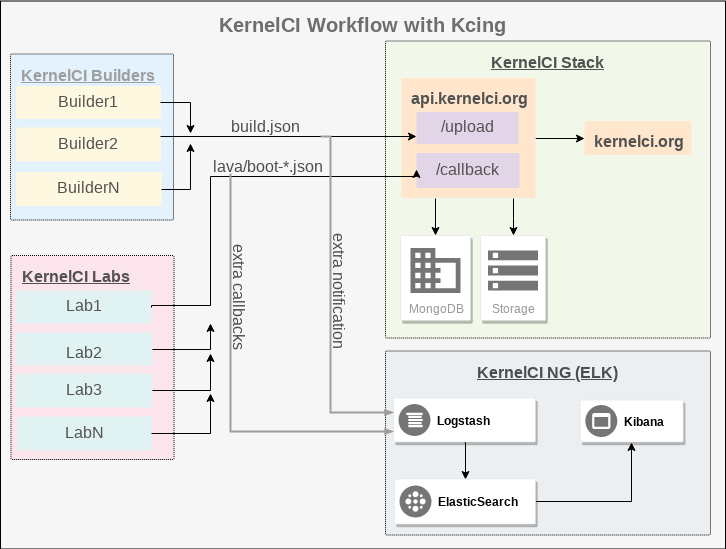
Now we have the ELK stack acting as an alternative backend for KernelCI. Please keep in mind that the main purpose of KCING is giving Linux Kernel developers better ways to visualize data. It is no intention of this project to replace KernelCI’s bisections, regressions and its other features.
Our data model
We got data and we tools for handling data. The challenge now is related to how to store that information on ElasticSearch in a way that it’s easy to use Kibana to consume indexes for building meaningful dashboards. Arranging the data took most of the effort in this project, so here’s the current data model we ended up with. There are 4 indexes in ElasticSearch: build, boot, test and log.
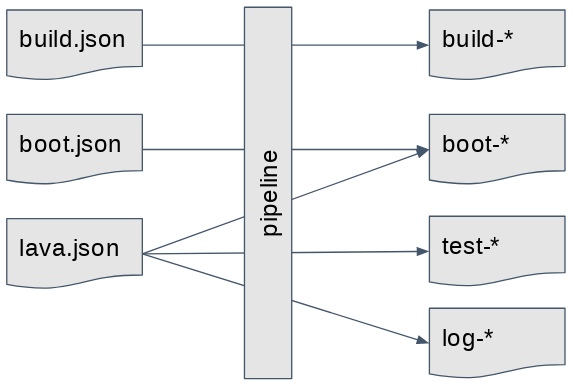
The build index contains pretty much whatever is in build.json files. The boot index is filled with all information contained in boot.json and lava.json files but in a selected way. KernelCI would generate boot.json files for LAVA and non-LAVA labs. In this case, we’re considering boot.json files from non-LAVA labs only. In KCING, we generate our own boot.json out of lava.json. The latter is also used to fill indexes log and test.
An important detail about our data model is that it goes in the opposite direction of what regular databases do. Instead of normalizing the data and exchanging ID’s across tables/indexes, ElasticSearch pushed us into de-normalization. Our research has shown that ES works better without joins, and even better at indexing strings. Bottom line, instead of having a number as ID, we defined it as a sort of “composite primary key”, containing tree, branch, git-describe, defconfig, architecture for the build index. Appending that with lab_name, board and boot_result we formed the ID for indexes boot, test and log. While that didn’t duplicate data for build and boot indexes, it did for the remaining ones. ES seemed to be quite smart in optimizing disk space related to data duplication.
Special attention is needed regarding log and test indexes. For now, they are only filled out by lava.json files. Also, it is good to have in mind that for every lava.json file, ES will store 1 boot, Y tests and X logs documents in their respective indexes, where Y is the number of tests run and X is the number of log lines of that LAVA job
Visualizations
After we shook on the data model, the fun was about to begin. We put in a few samples from KernelCI using KCING’s command line and started to draft some dashboards. It started simple, mainly trying to get same good old listings of builds and boots.
TIP: zoom in the page to better visualize images below
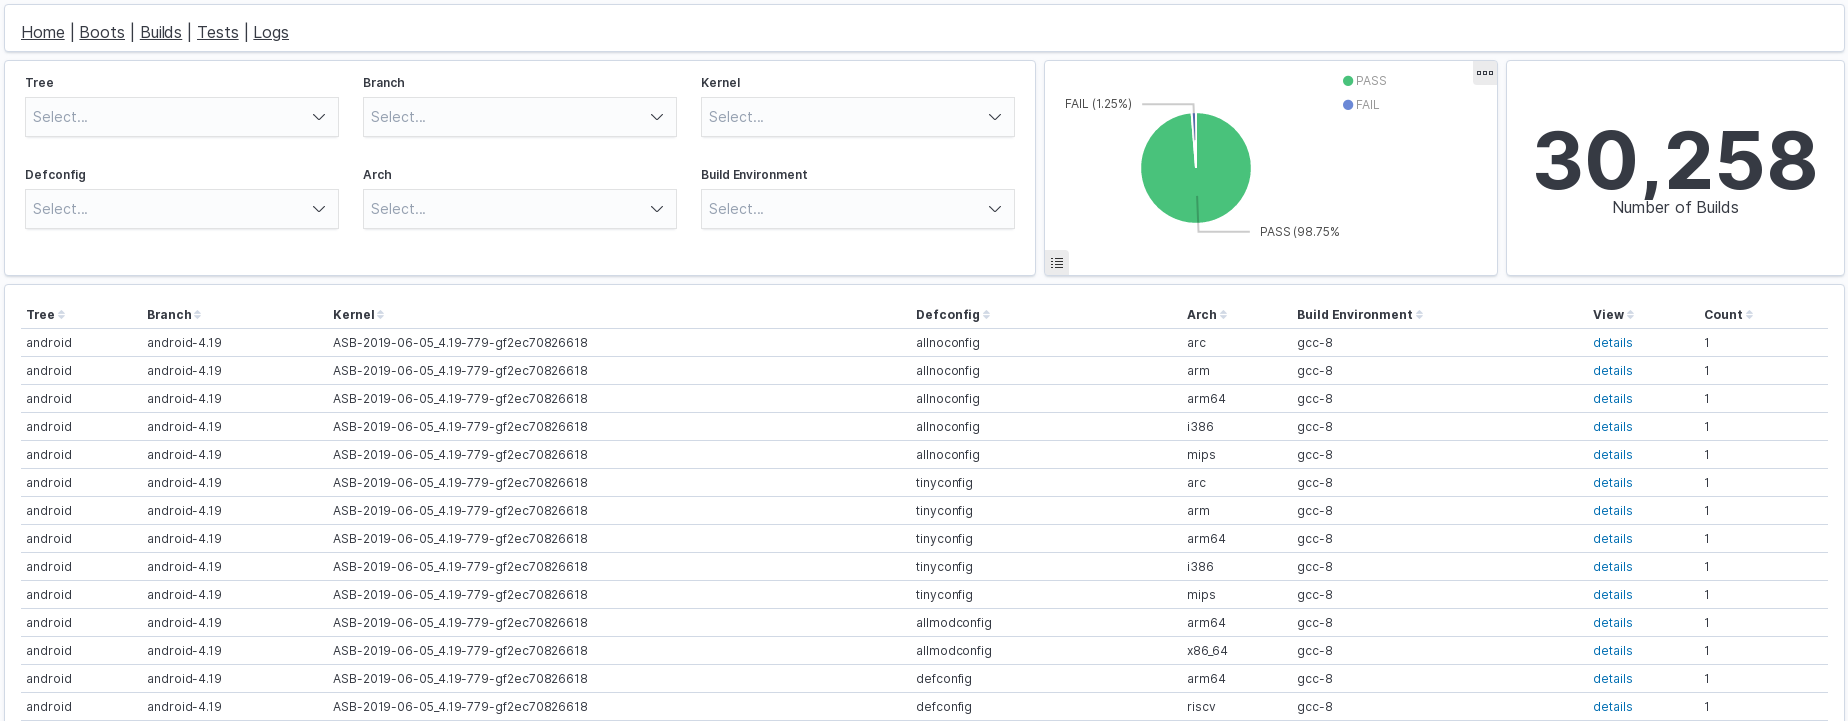
In the dashboard above there is a list of latest builds submitted to KernelCI and several filters that easily allow users to search whatever they want. Also there is a pie chart with pass/fail percentage and a text with the number of builds currently stored. As filters are applied, both pie chart and the text pane, as well as the table, updates accordingly. All that was accomplished in about an hour given or take (once we got all data in).
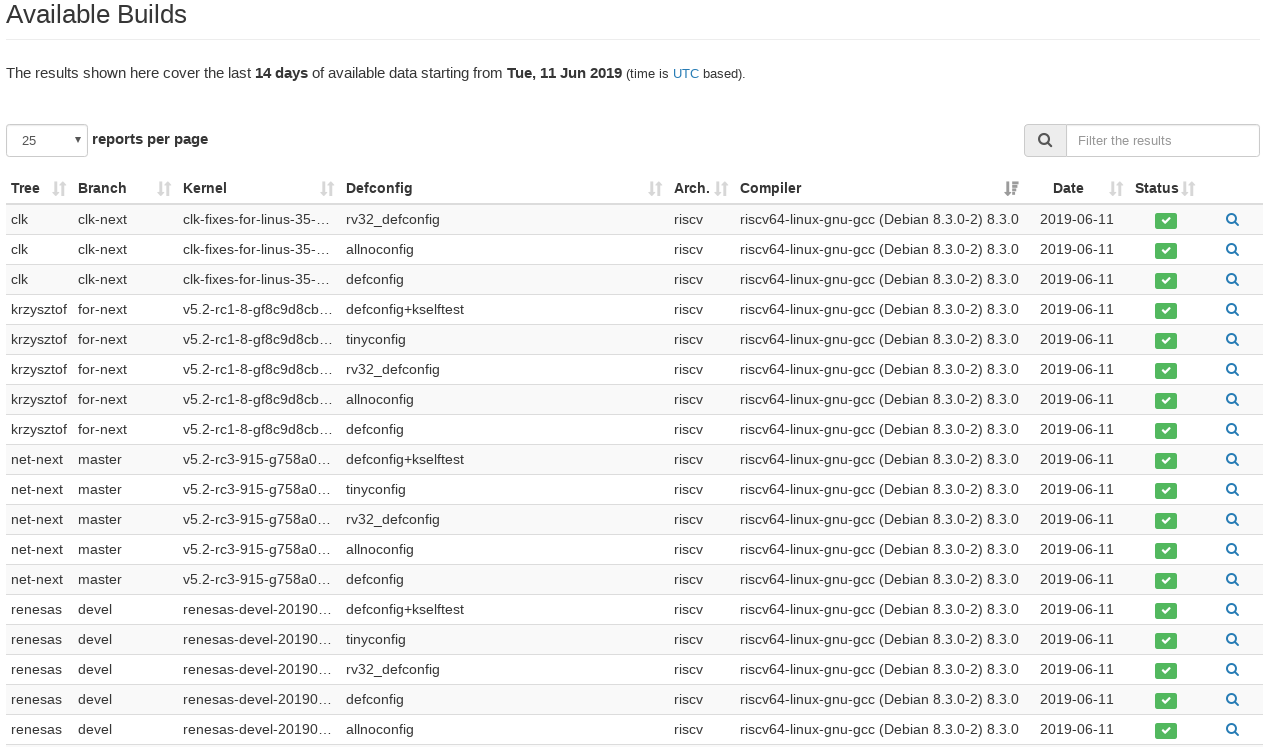
The picture above is KernelCI’s current visualization of latest builds. It would take a lot of more time to do the same Kcing features in the table above.
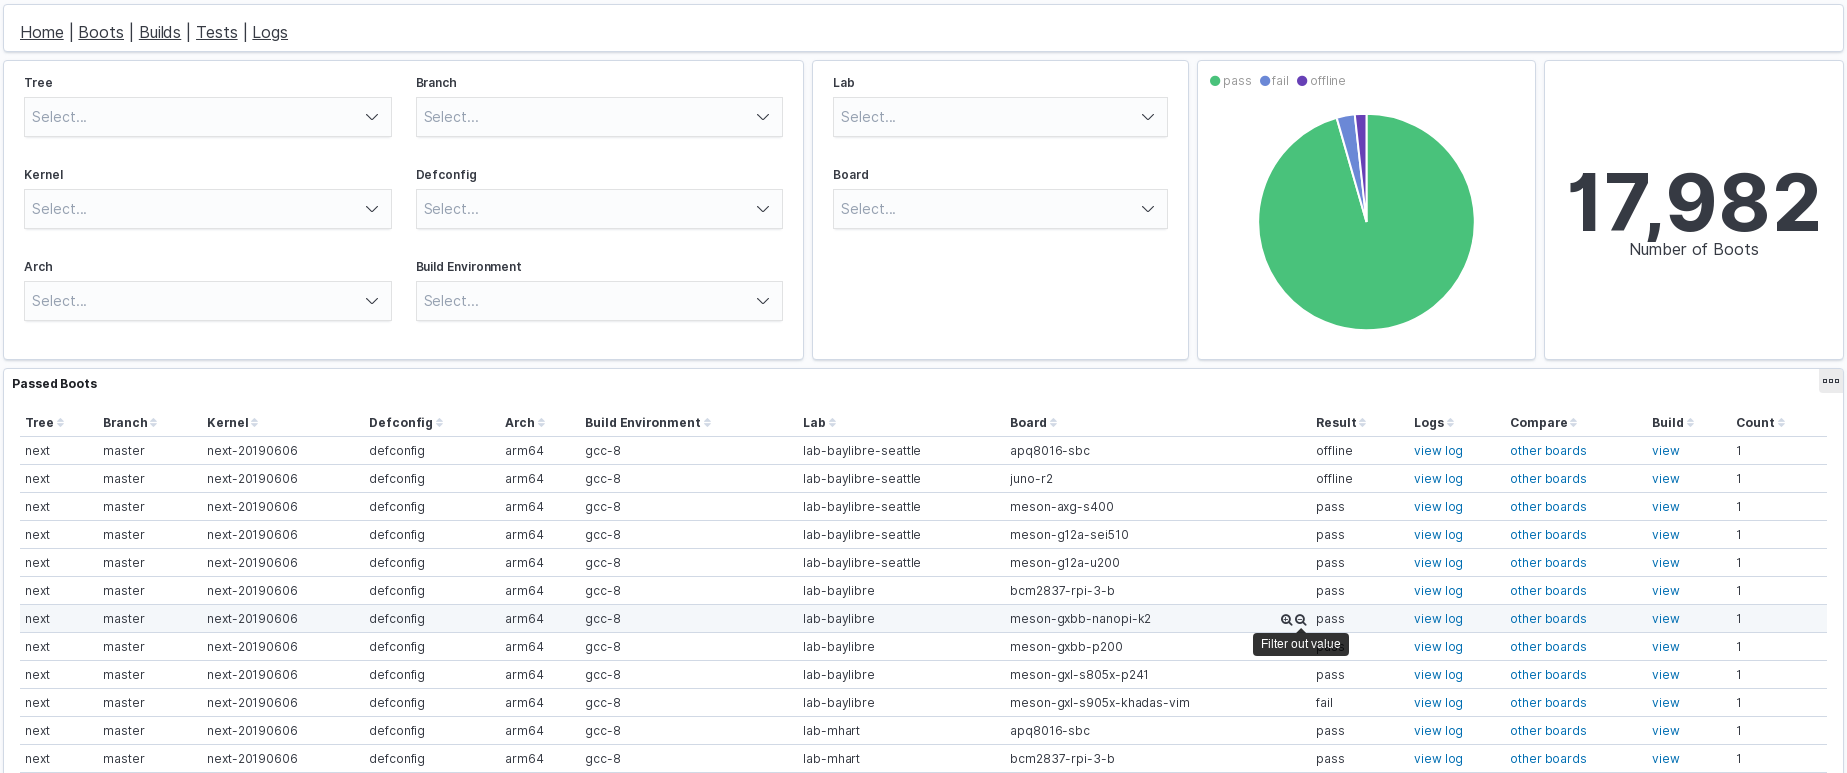
Now it’s time for some interaction! Next image shows the boot dashboard, including a pie chart displaying the percentage of boots that passed, failed or were offline. There are links pointing to that boot log, a link to compare that same boot in other boards in other labs and a link to the build details that generated the image of the boot.
After clicking on “view log”, the user would be redirected to a page like the one below.
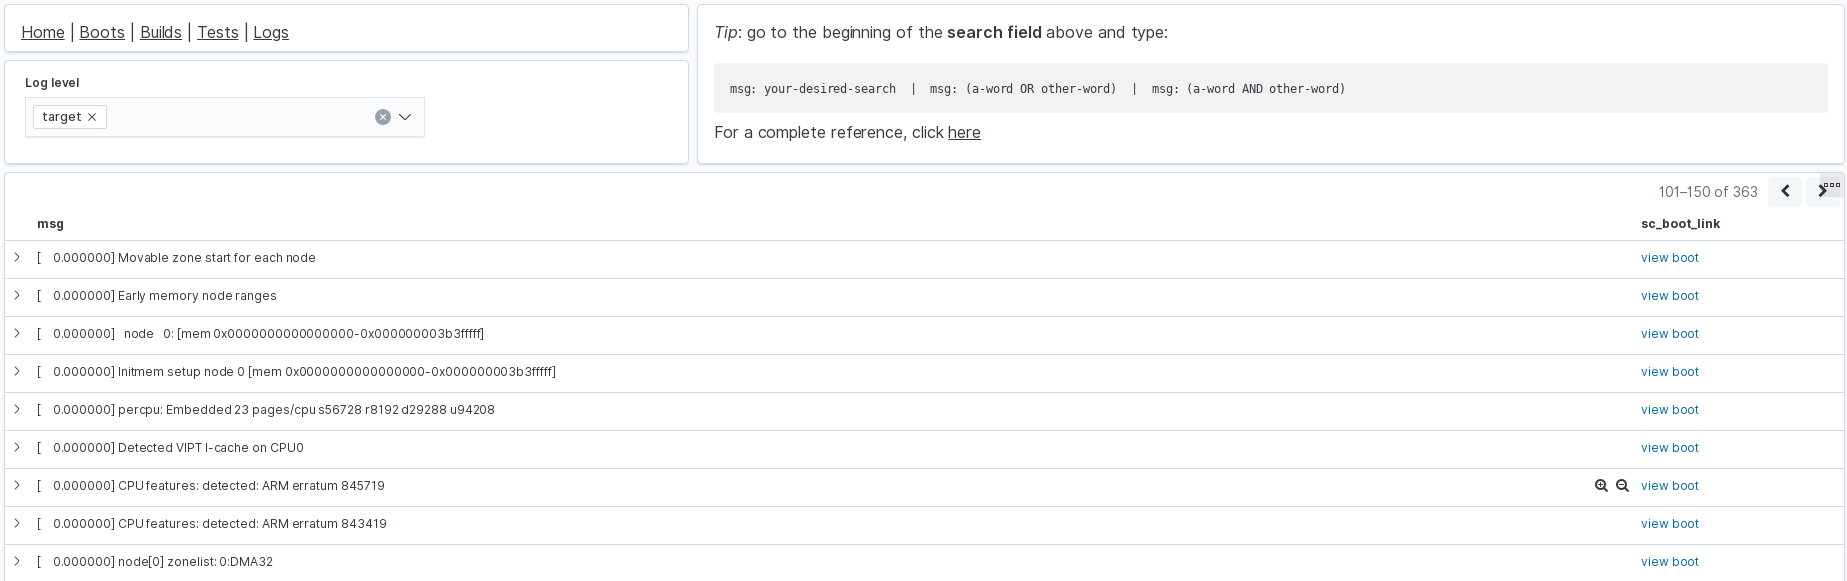
The log dashboard is a plain log viewer, which in this case, is displaying all logs belonging to that specific boot. Although the logs are paginated, the user can filter out log messages by using the search box on the top of the page (not shown in the picture).
Another useful comparison tool is when clicking on “other boards”, the user would be redirected to a page like this one below.
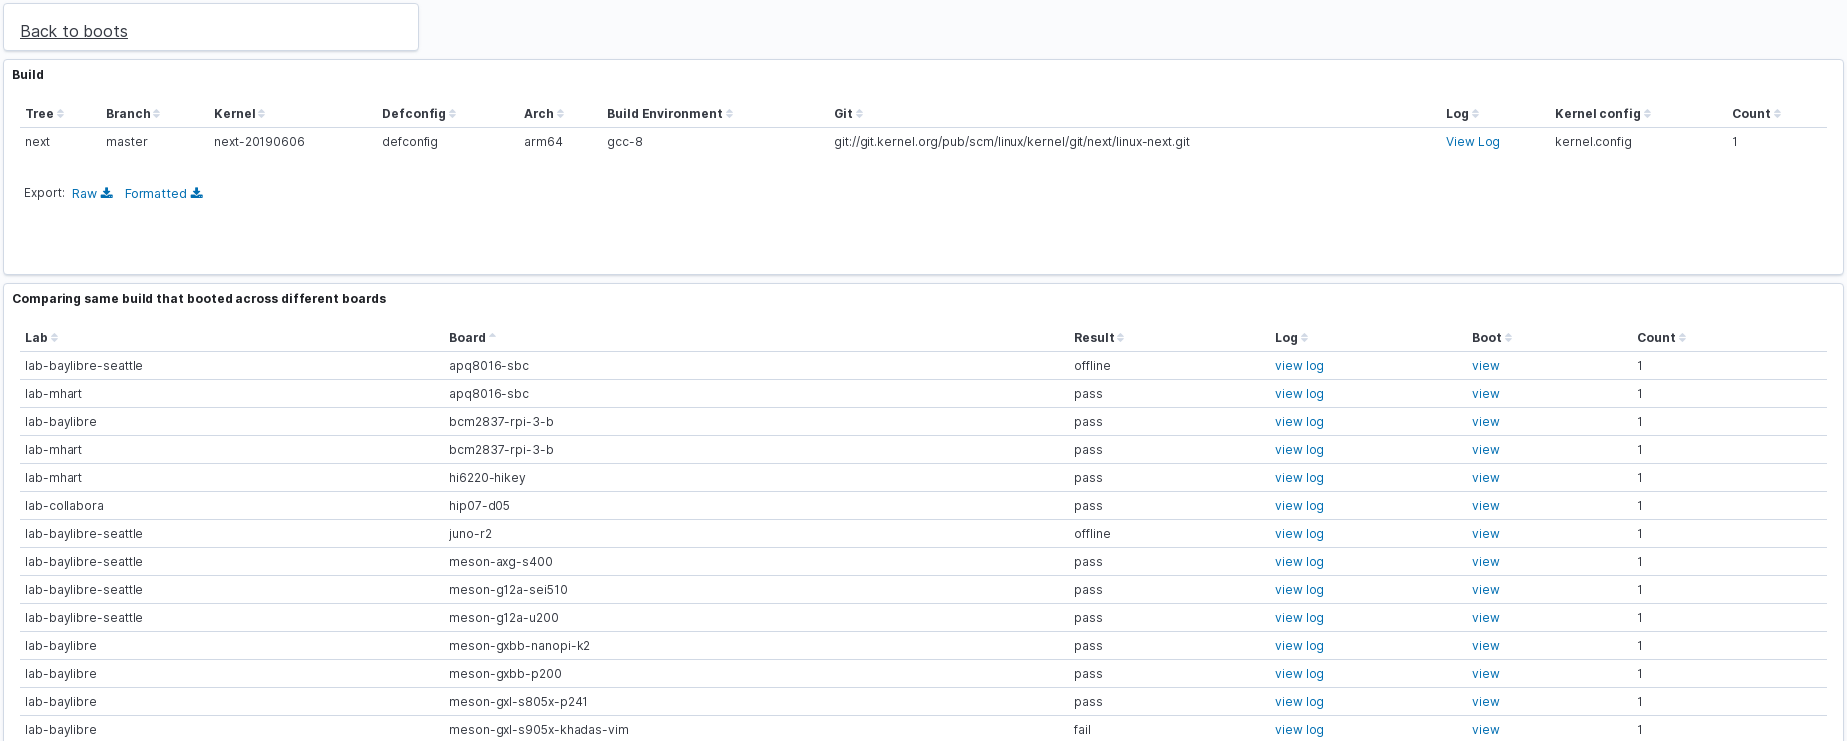
In this visualizations we get the same built image being booted in different boards among KernelCI labs.
Lastly, the image below shows a sample of the tests dashboard. It lists all tests that were run on a LAVA lab.
Filtering tests by tree, or branch, or even by test suite and test name comes in handy when a user needs to compare that same test in other boards, or even view the log line exactly where that test executed (when available).
Conclusion
This research project has proven to work and generated good visualizations. Work is still being done to have KernelCI send live data to a Kcing instance. For now, we managed to scrape KernelCI’s storage files to feed an ES instance.
The main focus of this post is to give you an overview behind Kcing’s idea. All implementation can be found at its github repository, there you’ll find instructions to set up your own instance of Kcing.
Please let me know of any questions you may have on that subject. Thanks for your time and attention!
Chaws